Crashlytics doesn’t do web.
So your native app reports its crashes, and your web app throws them into a console in a user’s browser. This closes the other half — and logs your backend in the same shape — in a project you already own.
$ npm install @dasasian/firebase-structured-logger
One package for the frontend and the backend — wire the client, add the log function, and upload source maps at deploy.
MIT · 1.0.0, stable API · also on npm
Why it exists
Almost every exception your web app throws is written to a console you will never open. It happens on a device you do not own, in a browser you cannot reach, and it stays there until the tab is closed. Your backend has logs. Your native app has crash reporting. The web half has a console.error in a user’s browser.
Which is why the honest state of most web apps is that nobody knows how often they break. Not “we have not triaged it” — nobody knows. The only errors you hear about are the ones a user cared enough to describe, and they describe them as “checkout is weird”.
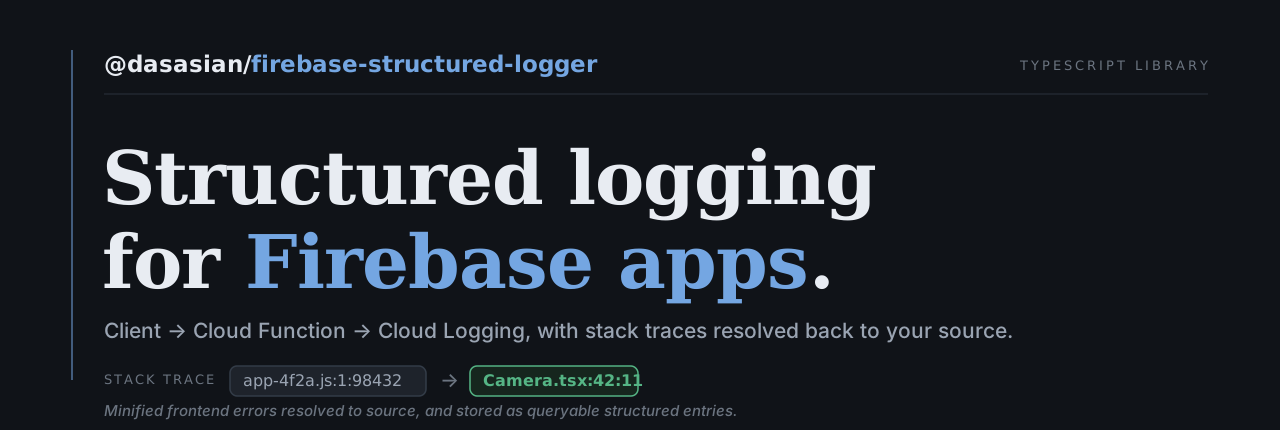
Getting them off the device is only half of it. A production stack trace is close to useless on its own: the line it points at — app-4f2a.js:1:98432 — is a spot in a minified bundle nobody has read, and by the time you are looking, the build that produced it may already be gone. So frontend errors get captured, technically, and then ignored, because reading one costs more than the bug.
This closes both. Frontend events go to a function you deploy, which symbolicates the stack against the source maps for that exact release — the trace comes back as Checkout.tsx:42:9, the file and line you actually wrote — and writes a structured entry: severity, the labels you care about, who the user was, what screen they were on, the breadcrumbs before it, and any files you attached.
One query, both halves
Frontend and backend write to the same stream in the same shape. One filter reads the whole story, in order:
labels.userId="<uid>"
10:42:03.114  INFO   screen=checkout      click "Apply code"
10:42:03.118  INFO   screen=checkout      applying discount SAVE20
10:42:03.402  INFO   fn=applyDiscount     started
10:42:03.611  ERROR  fn=applyDiscount     coupon lookup failed: timeout
10:42:03.798  ERROR  screen=checkout      TypeError at Checkout.tsx:42:9
Two of those came from a browser and three from a server, and you never had to think about that. Every label on them was attached automatically — you write the message, the rest rides along.
A hosted error tracker cannot print this. Your client errors live in its database and your backend logs live in your cloud, and correlating them means two systems and a timestamp.
They group into issues
Google Cloud already runs an error tracker in your project. Error Reporting reads Cloud Logging, collapses repeats into issues, and gives you occurrence counts, a resolution state, notifications, and a field to link your own tracker. It costs nothing beyond the logs you are already writing.
It groups by exception type plus the five top-most stack frames. Which is why, for almost every web app, it does nothing at all: those frames read app-4f2a.js:1:98432, they change every release, and no two crashes ever look alike.
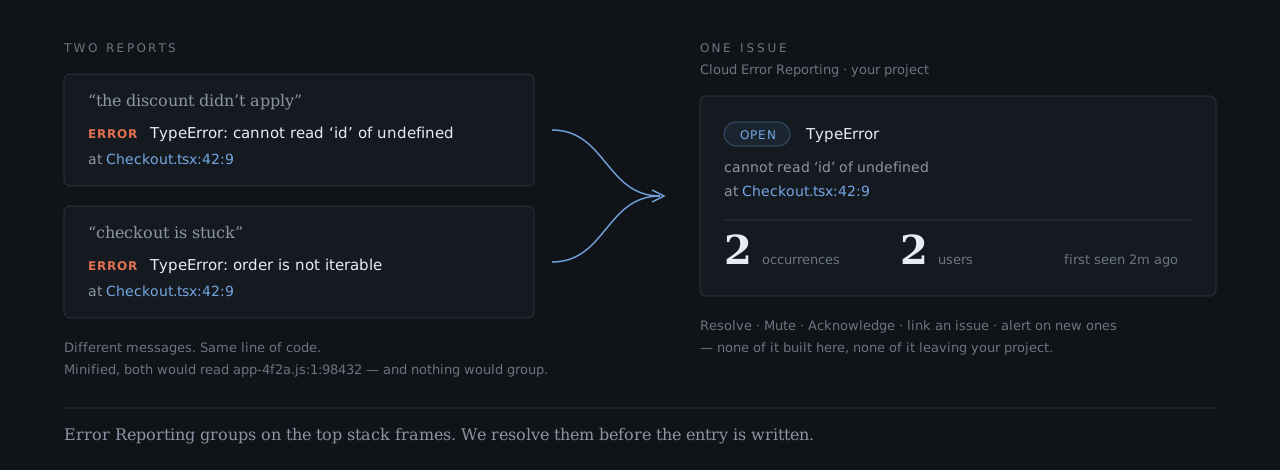
We resolve the frames before the entry is written. So two different complaints, from one line of code, arrive as one issue you can resolve — and the console that does it came with the project.
It doesn’t go quiet
A fixed error budget goes quiet exactly when things get bad. Fifty logs per page load is spent by mid-morning in an app someone keeps open all day, so the crash at lunch is never sent. And the usual answer to an error that fires two hundred times is to send the first few and drop the rest.
This budget refills, a log a minute, and keeps a fifth of itself for crashes, so a noisy warning cannot spend the room an error needs. Repeats are counted, not thrown away: three arrive in full, with their stack and breadcrumbs, and the next hundred and ninety-seven arrive as one line — when it started, when it stopped, which release, which user. Close the tab and the count waits on the device, goes out on the next visit, and is filed at the time it happened.
An entry too big for Cloud Logging’s line limit — 100 KiB, past which it arrives as broken text with no severity and no labels — is shortened before it is written, and the whole of it is kept beside it in Storage.
It tells you before it goes wrong
Almost every way a logging setup breaks is silent. Source maps published next to the app, so anyone can read your code. A backend on the wrong Node. Two copies of the same SDK. None of them throws; the logs just never arrive, or arrive unreadable, and you find out when you need them.
npx fsl doctor reads the project off disk and says what it finds, in a second, with no network and no credentials. It reports only what it can read from a file — it never guesses at your code — so when it says something is wrong, it is. Run it in CI and a broken setup fails the build instead of the incident.
Nothing leaves your project
Every entry, every breadcrumb, every screenshot stays in the Google Cloud project you already own, under your own IAM and your own retention rules. No third party receives it, no third party stores it, and there is no data-processing agreement to negotiate because there is no processor.
That matters most where it usually matters. Breadcrumbs and attachments are a record of what a person was actually doing, and a screenshot of a checkout page is not something everyone is free to hand to a vendor. If you are in health, finance, education, or anywhere a contract names where data may live, that is not a preference — it is the decision.
This is a hard problem
Entry labels have to be emitted under logging.googleapis.com/labels
Anywhere else and they land inside the payload, so
labels.appId="…" matches nothing. The logs
look perfect and cannot be filtered. Only a deployed run reveals
it.
AsyncLocalStorage’s enterWith() never unwinds
A request’s userId outlives the request, and
the next handler on a warm instance inherits whichever user came
before. Every log line it writes names the wrong person.
Source maps left in dist/ are your source code, published
Uploading them so a stack can be resolved is the easy half. Deleting them from the build output, so hosting cannot serve them, is the half people forget.
An old stack resolved against the current release’s maps
A stack naming a bundle that still exists will happily resolve against whatever maps are deployed now — giving line numbers that are confidently wrong. Worse than none, because nothing signals it.
An unrecognised severity destroys the entry
Both dispatch paths look the value up in a fixed table, a miss
resolves to undefined, and calling it throws inside
the write. The entry vanishes with no diagnostic — and
slips past the severity floor on the way there.
A trailing slash on a Cloud Storage prefix is a different object
fsl//r7/app.js.map is not
fsl/r7/app.js.map. Storage keys are opaque strings
and the double slash is not collapsed, so a slash typed out of
habit silently splits the writer from the reader.
Checking a rate limit and spending it as two calls double-counts
Called from two layers, an error is checked against the session budget twice and counted against it twice, quietly making a configured limit of 50 a limit of 25.
The Cloud Logging client does not surface errorGroups
Read grouping through the Node client library and the field is simply absent, though the REST API returns it. You conclude, wrongly, that nothing grouped.
Every one of those is handled here, and each has a test that fails if it comes back. The list is not finished — it grows every time this runs against something real. That is the honest pitch: not that this is complete, but that someone is still walking into these and fixing them. Code you wrote yourself is frozen the day you wrote it.
What it isn’t
The grouping is Google’s Error Reporting, running in your project. We make its input legible; we do not build or run it. There is no assignment, no ownership, no dashboard of ours — what exists is Google’s console, plus whatever queries you write.
There are hosted error trackers that do all of that, and do it well. What you give up here is a polished product: no vendor UI, no onboarding flow, no support contract. What you get is every frontend and backend event landing straight in a project you already own — one stream, one query language, grouped by a console that came with it, and nobody else holding a copy.
Also in it
Errors are only the failures loud enough to throw. A total that comes out wrong, a button that quietly did nothing, the right screen with the wrong data on it — none of those raise an exception, so none of them are logged, and you hear about them weeks later as “checkout is weird”. So there is a second way in: the user types a sentence, and it arrives carrying the same breadcrumbs, screen and labels an error would. The discount didn’t apply is a complaint. The same sentence with navigate_Checkout · apply_discount · total_recalculated underneath it is a reproduction.
The same logger shape runs on your backend — Cloud Functions, Cloud Run, or any Node service on Google Cloud — so backend and frontend read alike. And the whole thing has a local mode: the emulator writes the same entries to a JSONL file you can tail — or query from an agent through firebase-mcp-server, without deploying anything.
Under it
- Built with
- TypeScript, source-map symbolication (@jridgewell/trace-mapping), Cloud Storage for the maps, and ULID for ids. Firebase packages are optional peers — it runs without any of them.
- Entry points
- /client for the browser, /functions for the backend, and an fsl CLI that uploads source maps and installs the Claude Code skills.
- Symbolication
- Stack traces resolve against the source maps for their release, so a production error names the file and line you wrote, not a line in a bundle.
- Backend
- Cloud Functions, Cloud Run, or any Node server on Google Cloud — with or without Firebase. Off Cloud Functions it needs neither firebase-functions nor firebase-admin. It writes to stdout, so it has to run where Google collects stdout into Cloud Logging.
- Pairs with
- firebase-mcp-server — its /query-logs skill reads these entries, in Cloud Logging or the local JSONL.
- License
- MIT
Who wrote this
We are Dasasian, and this came out of shipping Firebase apps and getting tired of frontend errors that could not be read — every item on the list above cost us a real afternoon before it became a test. We build products and take on selected client work; if that is useful to you, hello@dasasian.com.
More open source
- gdocs-mcp
- A Google Doc as a local file, for an agent.
- firebase-mcp-server
- A schema-aware view of Firebase, for an agent.